Understanding the Data Analysis & Risk Interpretation module
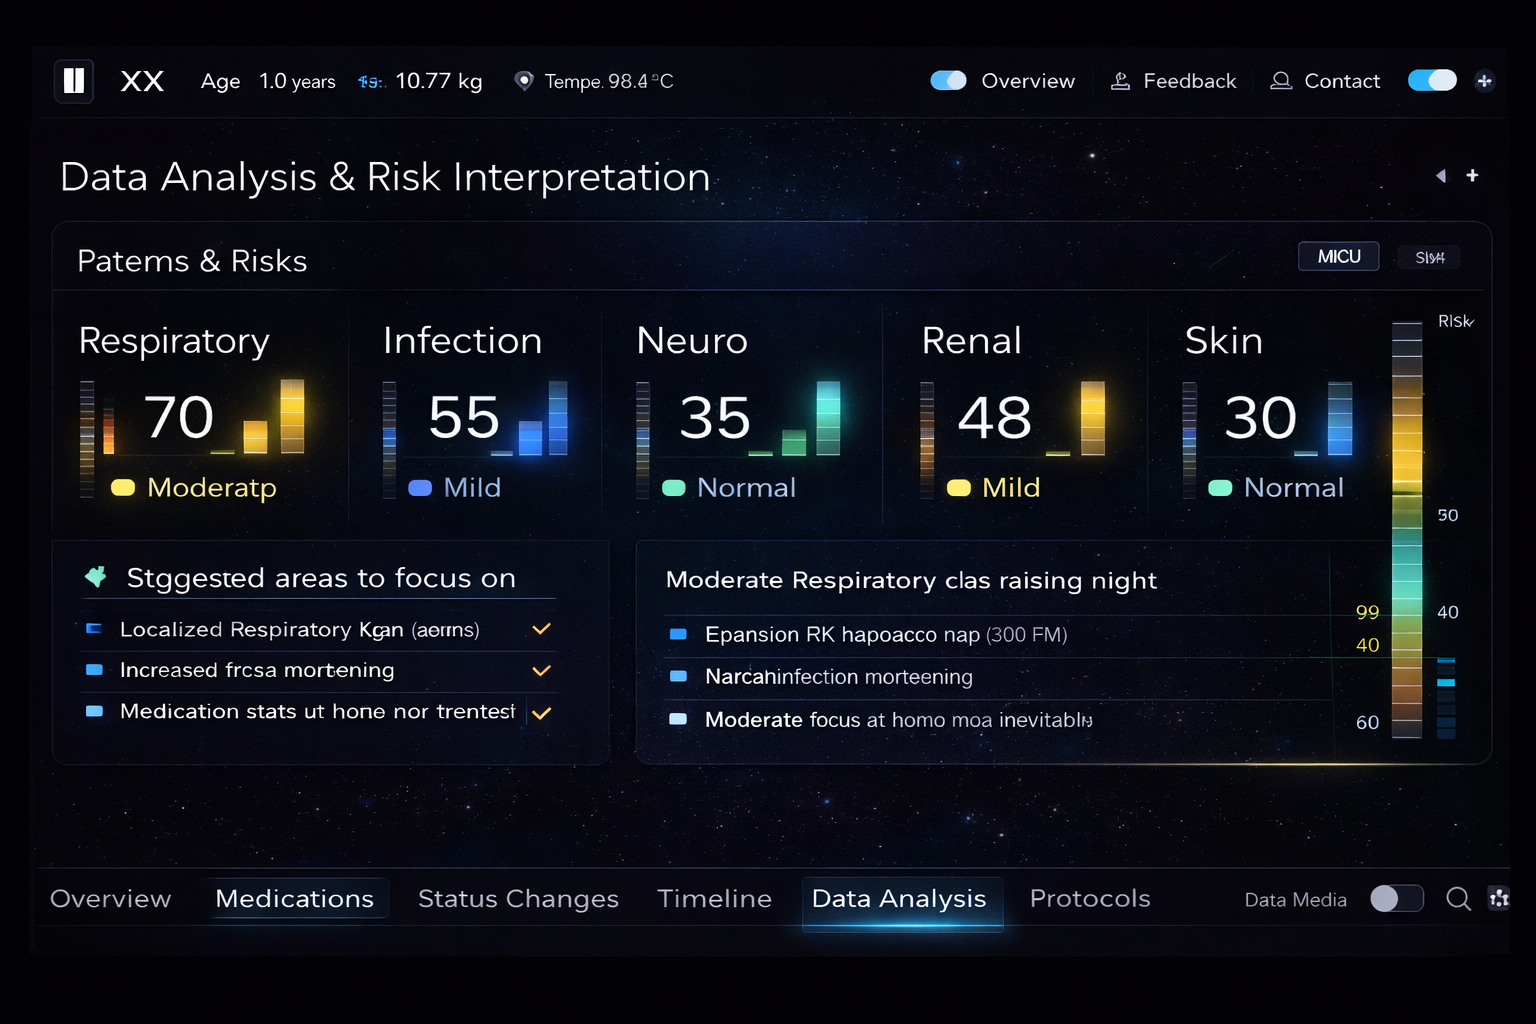
This module presents cone-shaped severity visualizations for each organ system, showing risk levels from 0% to 100% with color gradients that transition from green (low concern) through yellow (moderate) to red (high concern). The data analysis panels provide both a broad overview of all systems and detailed views of the most concerning areas. Pattern recognition across multiple data points helps surface signals that might not be apparent when examining individual metrics in isolation.
Why it matters clinically
Raw clinical data — vital signs, lab values, medication levels — requires interpretation to become actionable. Clinicians must not only understand individual data points but also recognize patterns across systems that indicate emerging risk. This module translates complex, multi-dimensional data into visual risk signals that support faster prioritization and more confident clinical assessment, essentially providing AI-assisted pattern recognition across the full clinical picture.
How AI could assist
The AI advisor in this module focuses on translating complex data into simple insights, highlighting anomalies or outliers, and explaining relative severity in general terms. It supports awareness of risk levels, prioritization of clinical attention, and understanding of data-driven signals — while always communicating uncertainty when appropriate.
Important: This system supports clinical decision-making and does not replace physician judgment. All AI-generated insights should be validated by qualified medical professionals.
Example Clinician Questions
Value when connected to EMR and real-time data
When connected to continuous data feeds from monitors, laboratory systems, and clinical documentation, this module can provide real-time risk scoring with machine learning-enhanced pattern detection. Integration with historical patient data and population-level benchmarks would enable more nuanced risk stratification and earlier identification of patients at risk of adverse events.
Help us improve this module
We are actively seeking feedback from clinical practitioners to shape the future of this platform.